Enhancing the Predictability Limits of ENSO with Physics-Guided Deep Echo State Networks
ByZejing Zhang
ENSO
El Nino
DESN
ORAS5
Climate Prediction
An ENSO real-time forecasting method based on ORAS5 reanalysis data and physics-guided deep echo state networks (DESN), combining climate-mode index construction, seasonal-cycle and trend removal, ensemble training, member selection, and Niño3.4 forecast results for 2026-2027.
Forecast initialization: August 2026 | Forecast horizon: 21 months (2026-09 to 2028-05)
ORAS5 (Ocean ReAnalysis System 5) is operated by ECMWF and is a Copernicus C3S global ocean reanalysis product. It has a resolution of 0.25° x 0.25°, 75 vertical levels, and covers the period from 1958 to the present. The assimilation system is NEMO ocean model + NEMOVAR 3D-Var FGAT, assimilating satellite SST, sea surface height, Argo temperature-salinity profiles, and sea-ice concentration.
This forecast uses two physical variables: sea surface temperature (Sea Surface Temperature, SST sosstsst) and depth of the 20°C isotherm (Depth of 20°C isotherm, D20 so20chgt). The raw data are monthly climate gridded data, with a spatial resolution of 0.25° x 0.25°, covering January 1958–August 2026, a total of 824 months.
Processed Data
1. Construct regional time series: For the two variables (Variable), the regions (Region) corresponding to each mode (mode) are spatially averaged over grid points according to the following regions. Each mode obtains one time series, with 10 time series in total, each with a time length of 824 months:
#
Mode
Full Name
Region (lat, lon)
Variable
1
Niño3.4
Niño 3.4 Index
5°S-5°N, 170°W-120°W
SST
2
WWV
Warm Water Volume
5°S-5°N, 120°E-80°W
D20
3
NPMM
North Pacific Meridional Mode
10°-25°N, 160°W-120°W
SST
4
SPMM
South Pacific Meridional Mode
25°-15°S, 110°-90°W
SST
5
IOB
Indian Ocean Basin Mode
20°S-20°N, 40°-100°E
SST
6
TNA
Tropical North Atlantic Index
5°-25°N, 55°-15°W
SST
7
ATL3
Atlantic Niño 3 Index
3°S-3°N, 20°W-0°
SST
8
IOD
Indian Ocean Dipole
(10°S-10°N, 50°-70°E) - (10°S-0°, 90°-110°E)
SST
9
SIOD
Southern Indian Ocean Dipole
(25°-10°S, 65°-85°E) - (30°-5°S, 90°-120°E)
SST
10
SASD
South Atlantic Subtropical Dipole
(40°-30°S, 30°-10°W) - (25°-15°S, 20°W-0°)
SST
2. Remove the seasonal cycle:
That is, calculate monthly anomalies. Let the original series be X(t), where t denotes time and M(t) denotes the corresponding month in the climatological period. The monthly anomaly is:
X′(t)=X(t)−XM(t)
where:
X(t): original value
XM(t): mean value of the series for the corresponding month in the climatological period
X′(t): monthly anomaly
The climatological period is 1979-01 to 2009-12.
3. Remove the quadratic trend:
Convert time to the monthly index τ(t) and fit a quadratic trend:
X^′(t)=aτ(t)2+bτ(t)+c
After detrending:
X′′(t)=X′(t)−X^′(t)
where:
τ(t): monthly index starting from the beginning of the series
a,b,c: fitted coefficients of the quadratic trend
X^′(t): fitted trend
X′′(t): monthly anomaly after removing the quadratic trend
Finally, climate-mode indices with the seasonal cycle and quadratic trend removed are obtained.
2. Forecast Algorithm and Workflow
*Figure: Schematic workflow of the DESN real-time ENSO forecasting system. Climate-mode indices are extracted from ORAS5 monthly ocean reanalysis fields, including regional sea surface temperature indices and equatorial warm water volume. The processed indices are used to train the DESN model, which is then initialized with the latest available observations to produce rolling real-time forecasts.*
The 1. Climate mode definitions and 2. Extract raw data & 3. Data process steps shown in the figure have already been introduced in the first section.
The following is a brief introduction to the 4. DESN training and 5. DESN forecasting steps.
DESN is a physics-guided lightweight machine-learning forecast model. See:
Ensemble training: 10 x DESN(nl=1) + 10 x DESN(nl=2) = 20 members, each independently randomly initialized
Member selection: On the validation set, all combinations from C(20,4) to C(20,10) are exhaustively searched. The scoring function is the weighted Niño3.4 Pearson correlation (lead 1-12), and the optimal subset is selected
Real-time forecast: Iterative rolling. At each step, the DESN output is concatenated with the corresponding time TP encoding as the input for the next step, for a total of 21 rolling steps
3. Forecast Results
DESN Results
*Figure 1: DESN centered three-month Niño3.4 forecast initialized from August 2026 monthly data. The black curve shows the observed Niño3.4 index before initialization, and the blue curve shows the DESN ensemble-mean forecast afterward. Error bars indicate the lead-dependent ±RMSE, averaged equally over past and recent validation periods; leads 16–21 reuse the lead-15 value. Red and blue shading mark months exceeding the El Niño and La Niña thresholds, respectively. The vertical dashed line separates the observed past from the forecast future, and the annotated values indicate the strongest warm and cold anomalies during the forecast period.*
*Figure 2: Validation RMSE used for the DESN centered three-month Niño3.4 forecast initialized from August 2026 monthly data. The blue curve shows the lead-dependent RMSE estimated from validation experiments and used as the ±RMSE uncertainty range in the real-time forecast. The horizontal axis shows lead time from 0 to 15 months, and the vertical axis gives RMSE in degrees Celsius.*
This forecast is initialized from the August 2026 monthly mean data. DESN shows that the Niño3.4 monthly index has risen to approximately +2.62°C (about +2.33°C in the centered three-month curve) at initialization, indicating pronounced warming, and remains above the +0.5°C El Niño threshold early in the forecast. Warm anomalies continue to strengthen from autumn through winter 2026, peaking around December 2026 at approximately +2.68°C in the centered three-month mean, consistent with a strong El Niño event.
After early 2027, warm anomalies gradually weaken. The Niño3.4 index is expected to fall below the El Niño threshold around May 2027, then transition to neutral and cooler conditions. The forecast falls below the −0.5°C La Niña threshold from July 2027 and reaches its cold trough around December 2027, at approximately −1.36°C.
Overall, DESN favors a strong El Niño event during the second half of 2026 and winter 2026/2027, followed by a transition to La Niña conditions in summer 2027. The error bars show lead-dependent uncertainty estimated from validation RMSE, increasing over leads 1–15; leads 16–21 reuse the lead-15 value of approximately 0.96°C.
SN-XRO Results
*Figure 3: SN-XRO centered three-month Niño3.4 forecast initialized from August 2026 monthly data. The black curve shows the observed Niño3.4 index before initialization, and the blue curve shows the SN-XRO forecast afterward. Error bars indicate the lead-dependent ±RMSE, averaged equally over past and recent validation periods; leads 16–21 reuse the lead-15 value. Red and blue layered shading marks the months exceeding the El Niño and La Niña thresholds, respectively, with darker colors indicating stronger anomalies. The vertical dashed line separates the observations from the forecast, and the annotated values indicate the strongest cold and warm anomalies.*
*Figure 4: Validation RMSE used for the SN-XRO centered three-month Niño3.4 forecast initialized from August 2026 monthly data. The blue curve shows the lead-dependent RMSE estimated from validation experiments and used as the ±RMSE uncertainty range in the real-time forecast. The horizontal axis shows lead time from 0 to 21 months (leads 16–21 reuse the lead-15 RMSE), and the vertical axis gives RMSE in degrees Celsius.*
This forecast is initialized from the August 2026 monthly mean data, when the Niño3.4 monthly index has reached approximately +2.62°C (about +2.55°C in the centered three-month curve), indicating El Niño conditions (a weak La Niña occurred in late 2025 before initialization, with a centered three-month minimum of approximately −0.78°C). SN-XRO predicts further warming during autumn 2026, peaking around December 2026 at approximately +3.95°C in the centered three-month mean, consistent with a very strong El Niño event.
Warm anomalies gradually decay after early 2027 and are expected to fall below +0.5°C around July 2027, returning to neutral conditions. The index subsequently drops below −0.5°C in October 2027 and reaches a cold trough of about −0.83°C in December 2027. At the forecast endpoint in May 2028, it remains about −0.73°C, below the La Niña threshold.
Overall, SN-XRO favors a very strong El Niño developing in the second half of 2026 and winter 2026/2027, maturing in winter 2026 and early 2027, and peaking in December 2026, followed by a return to neutral conditions in summer 2027 and a transition to La Niña in autumn.
Researchers
Yu Zhao
Beijing Normal University, School of Systems Science · PhD Student
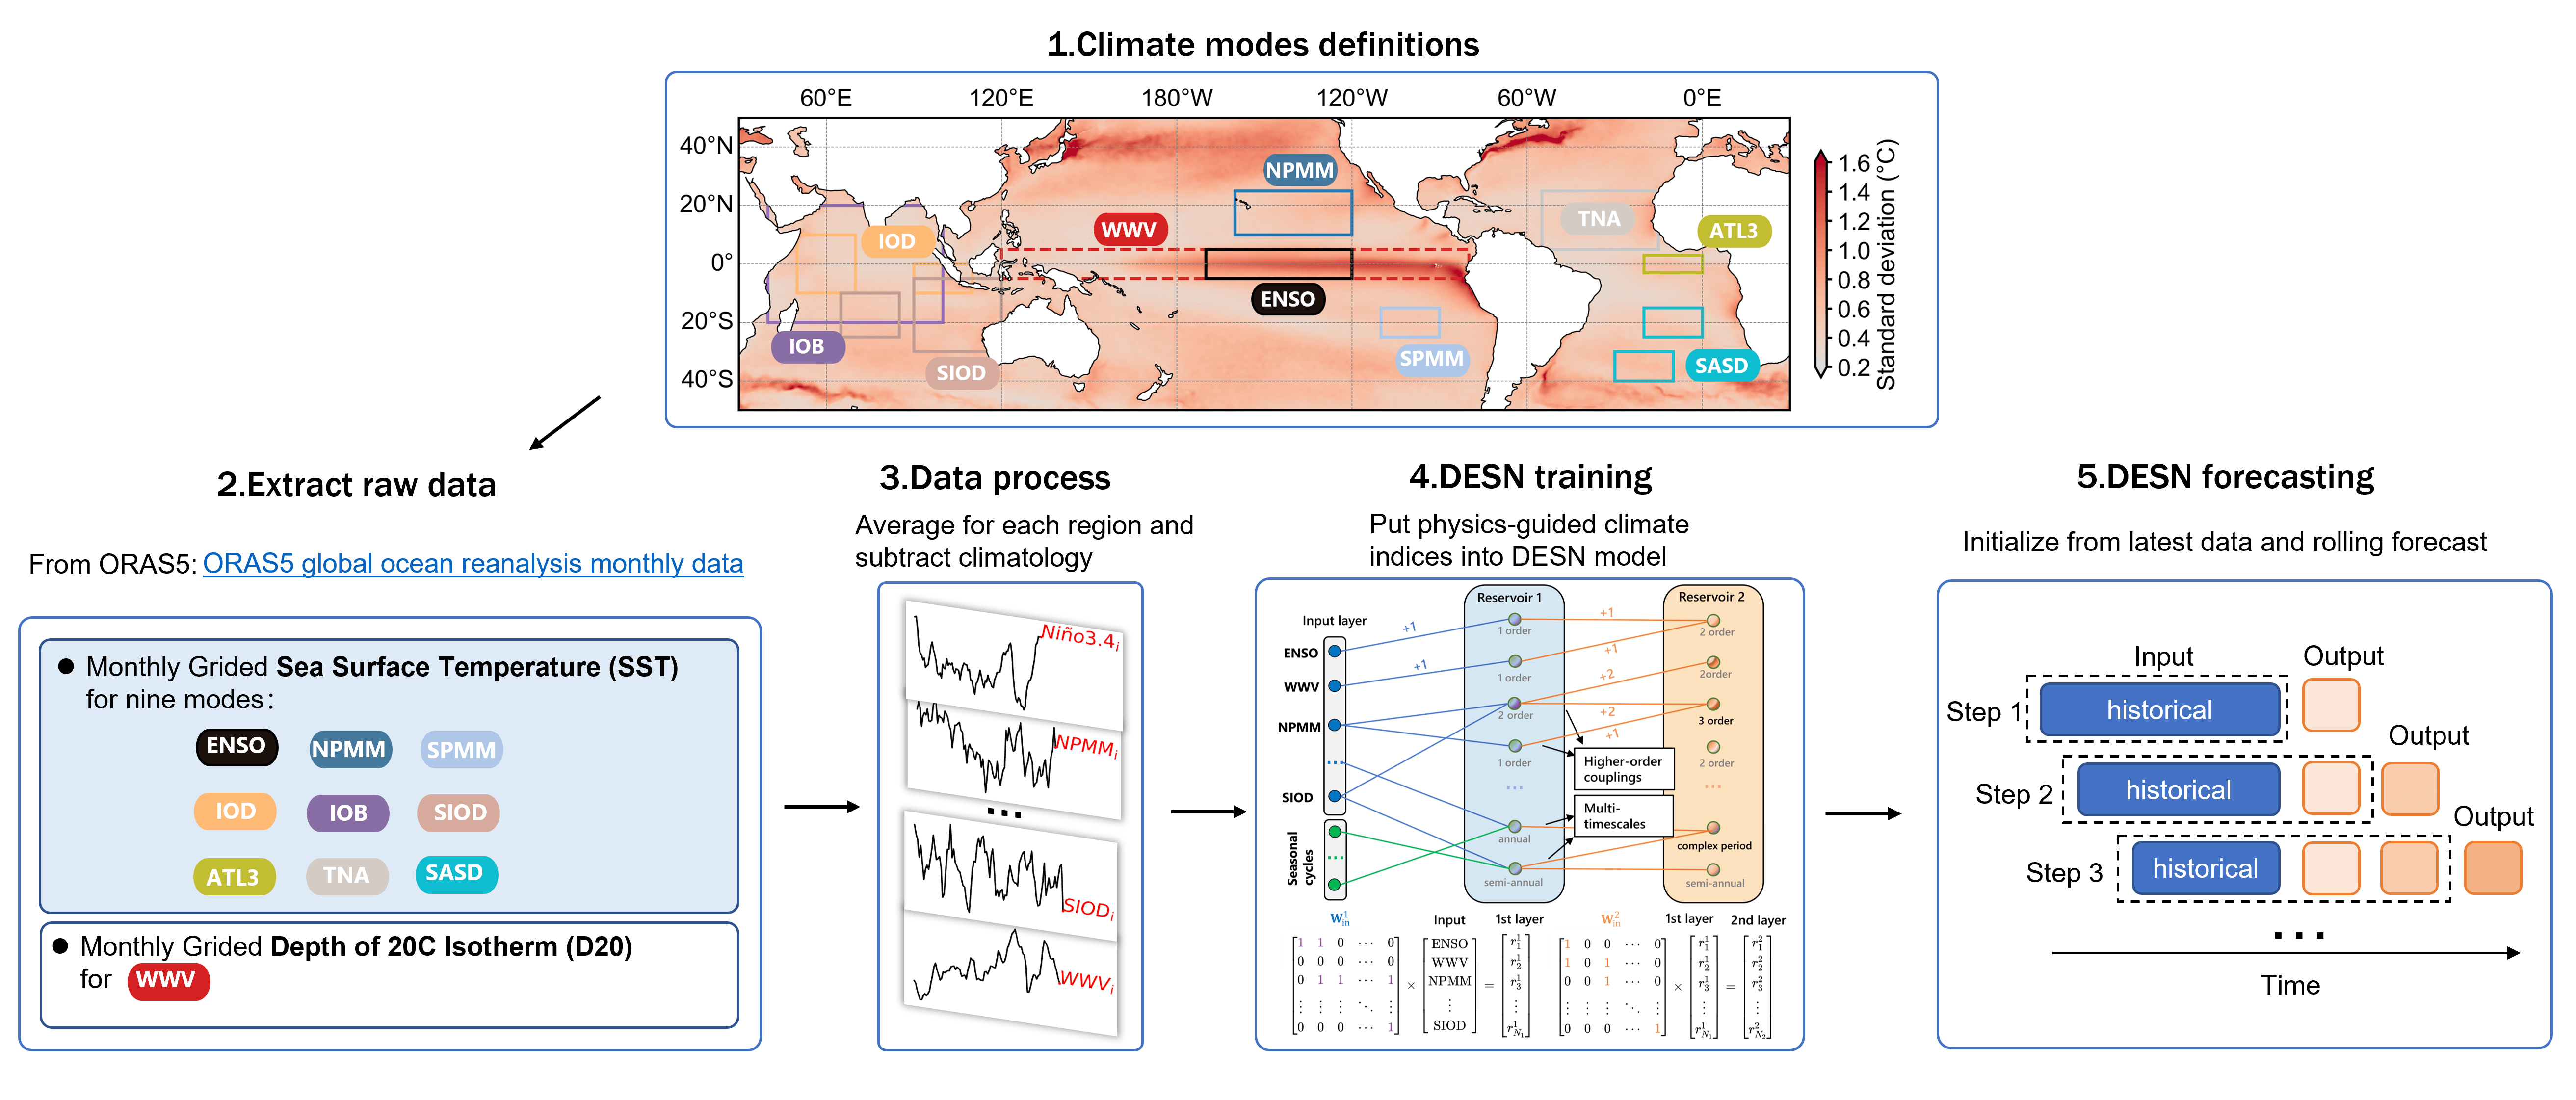
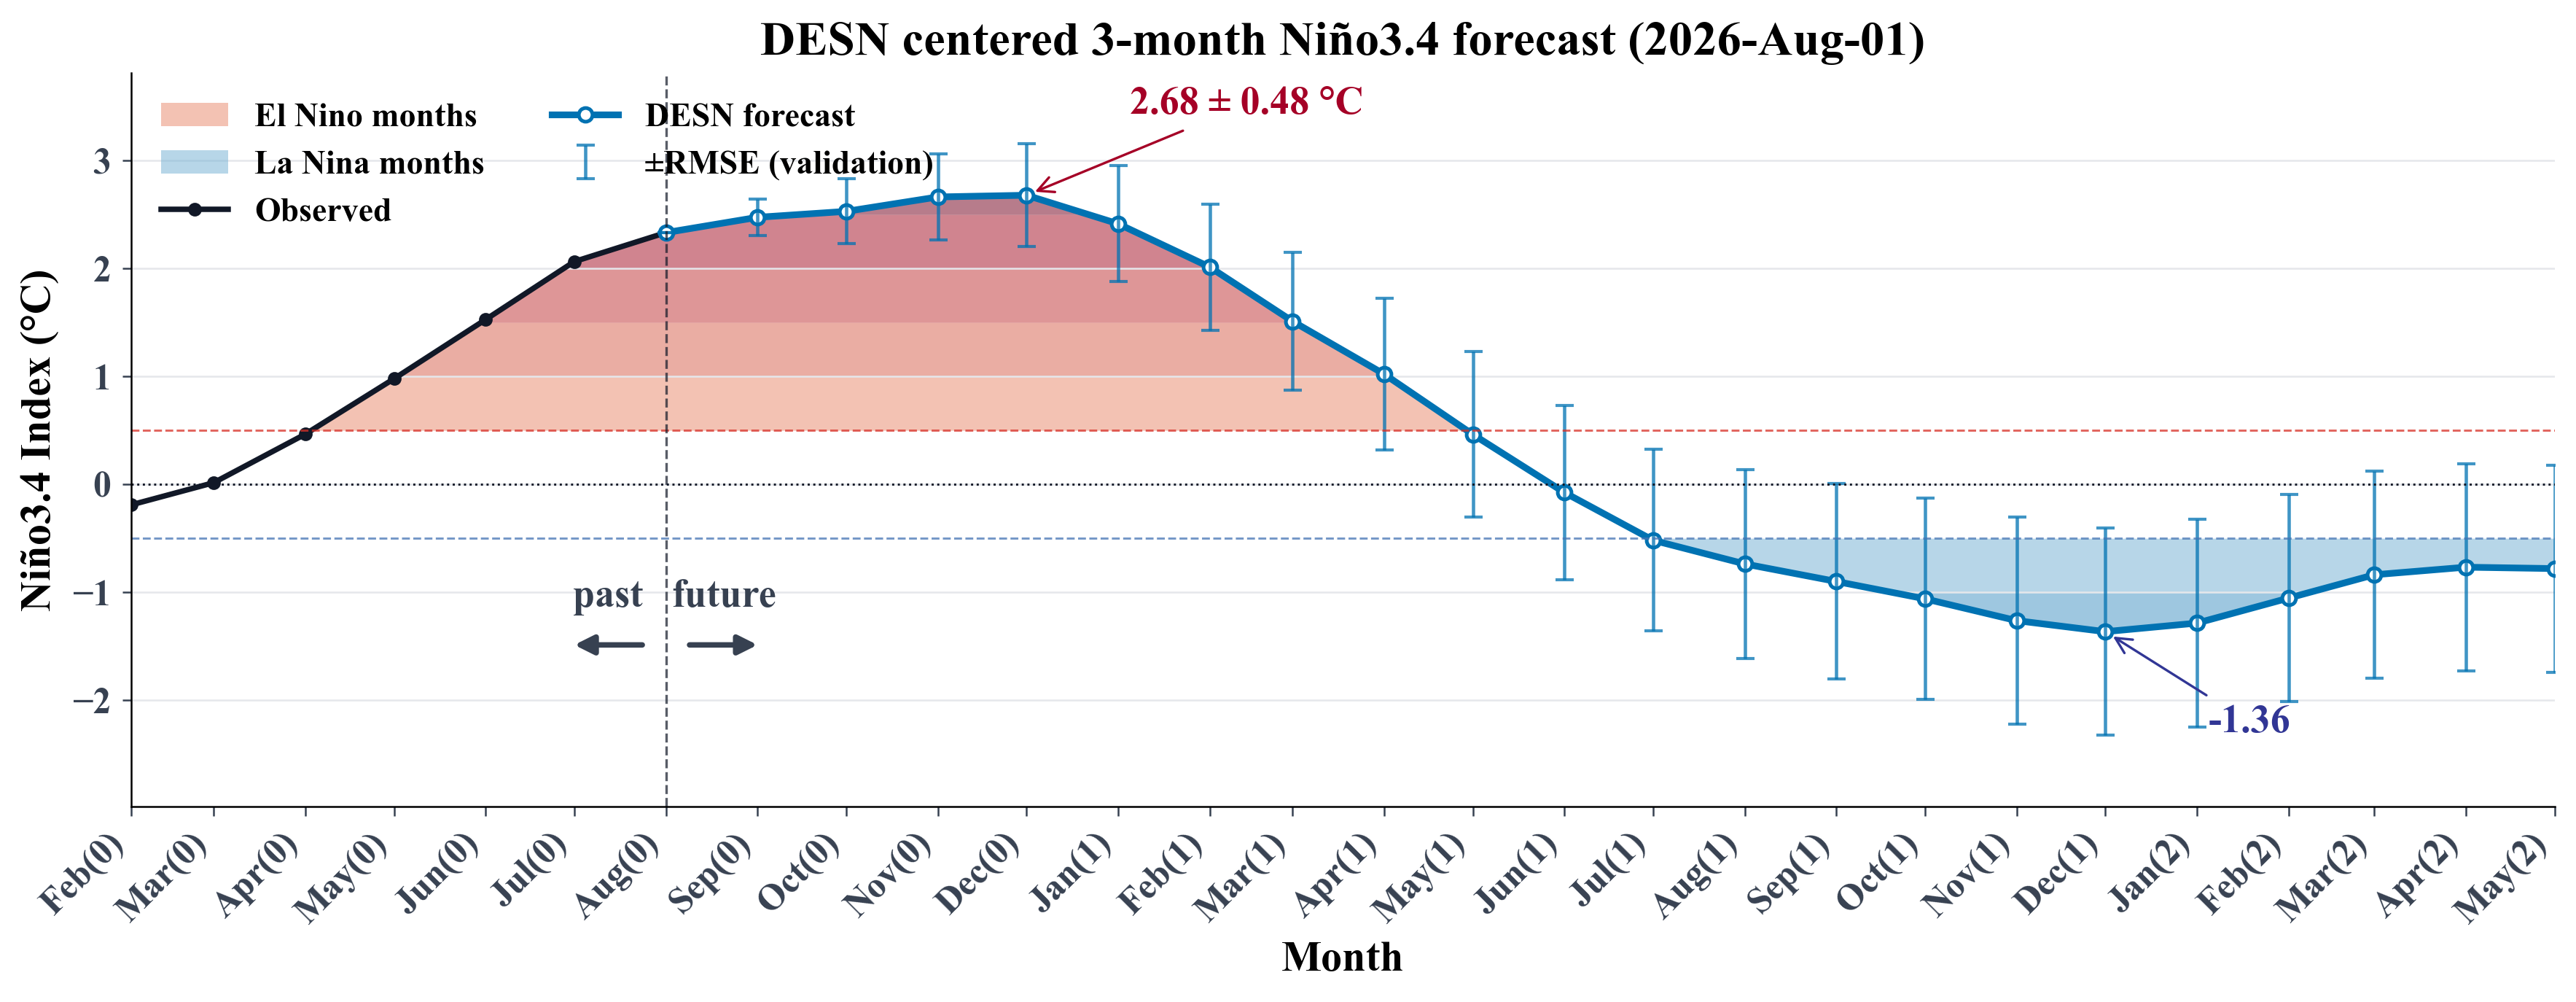
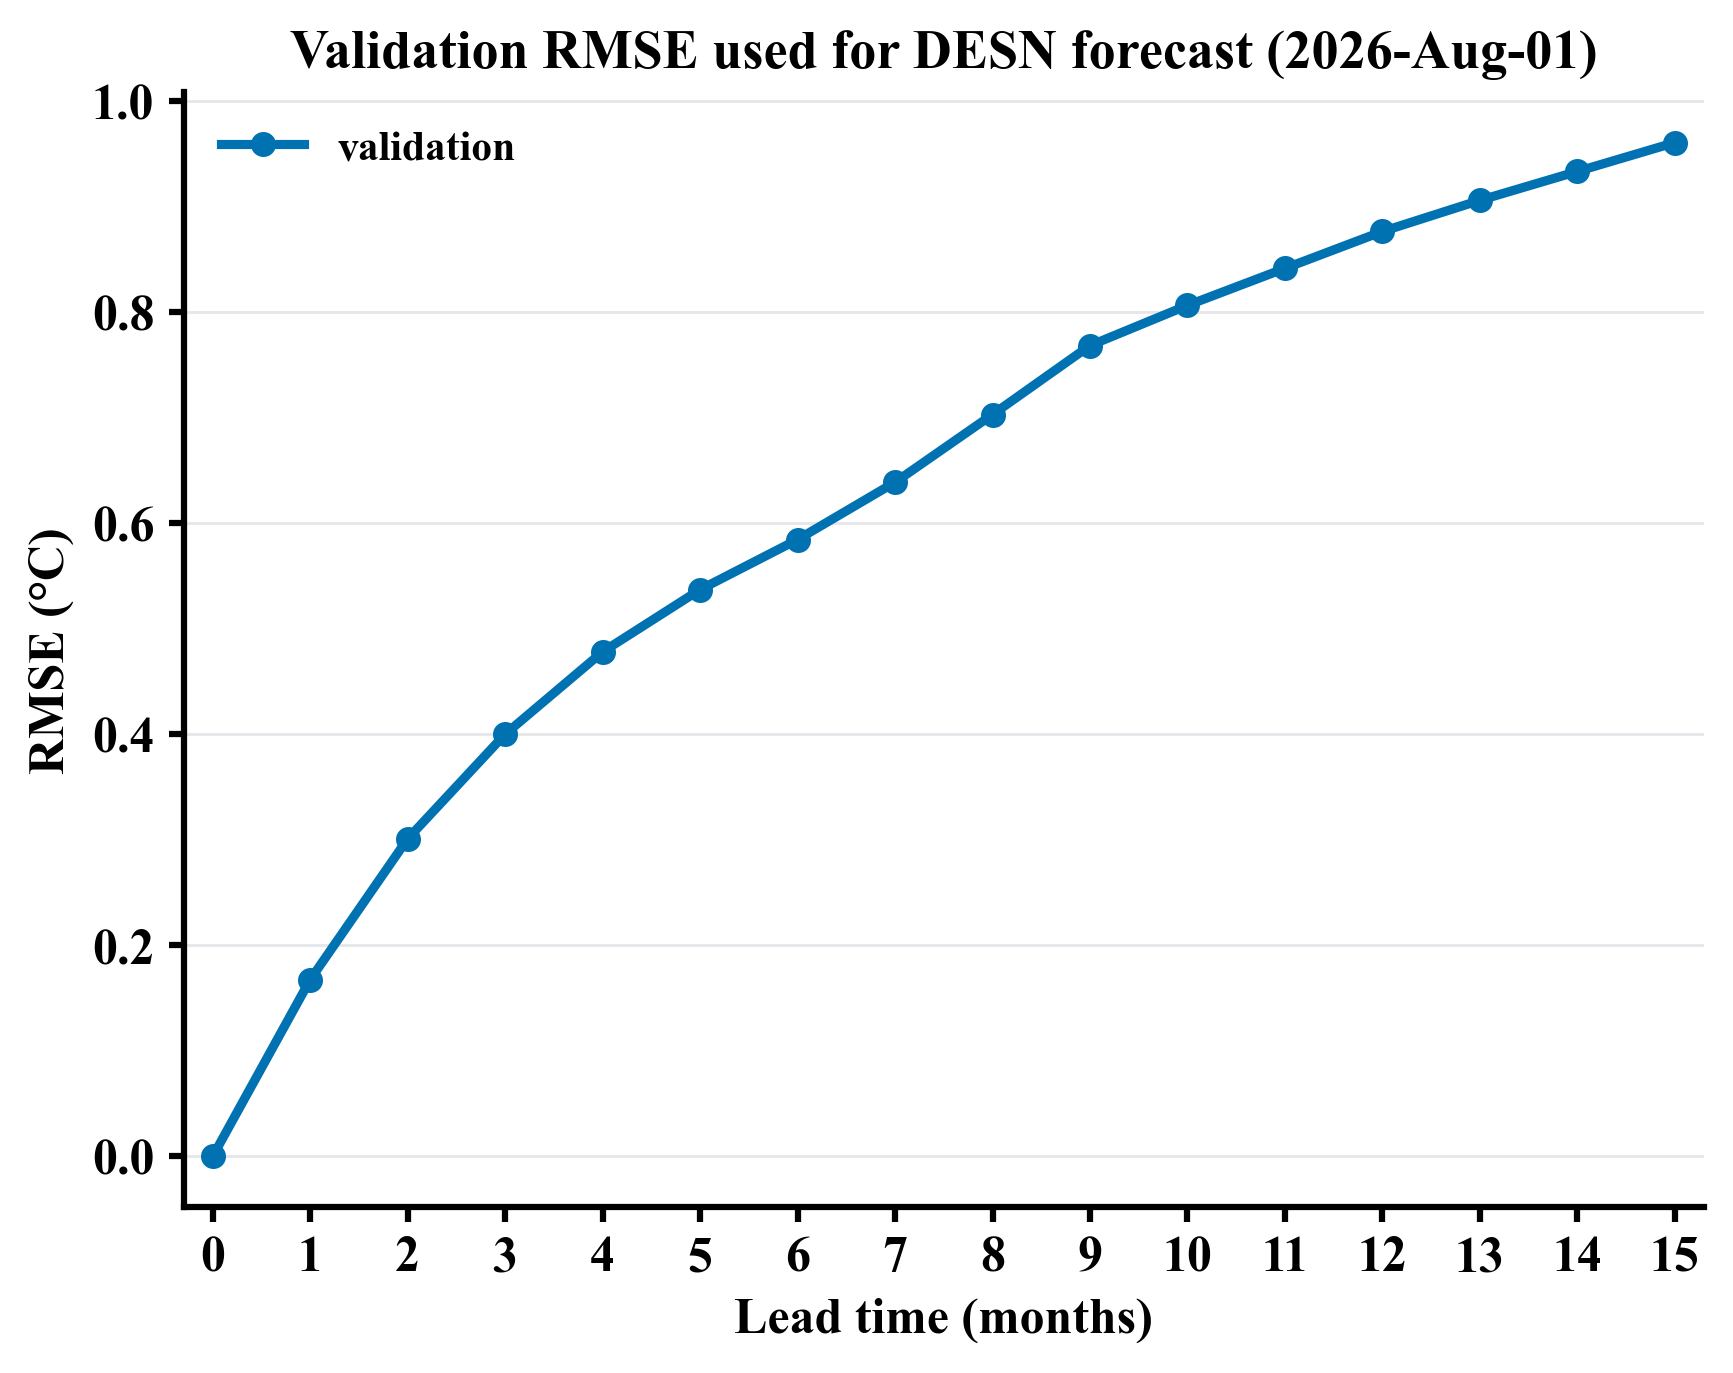
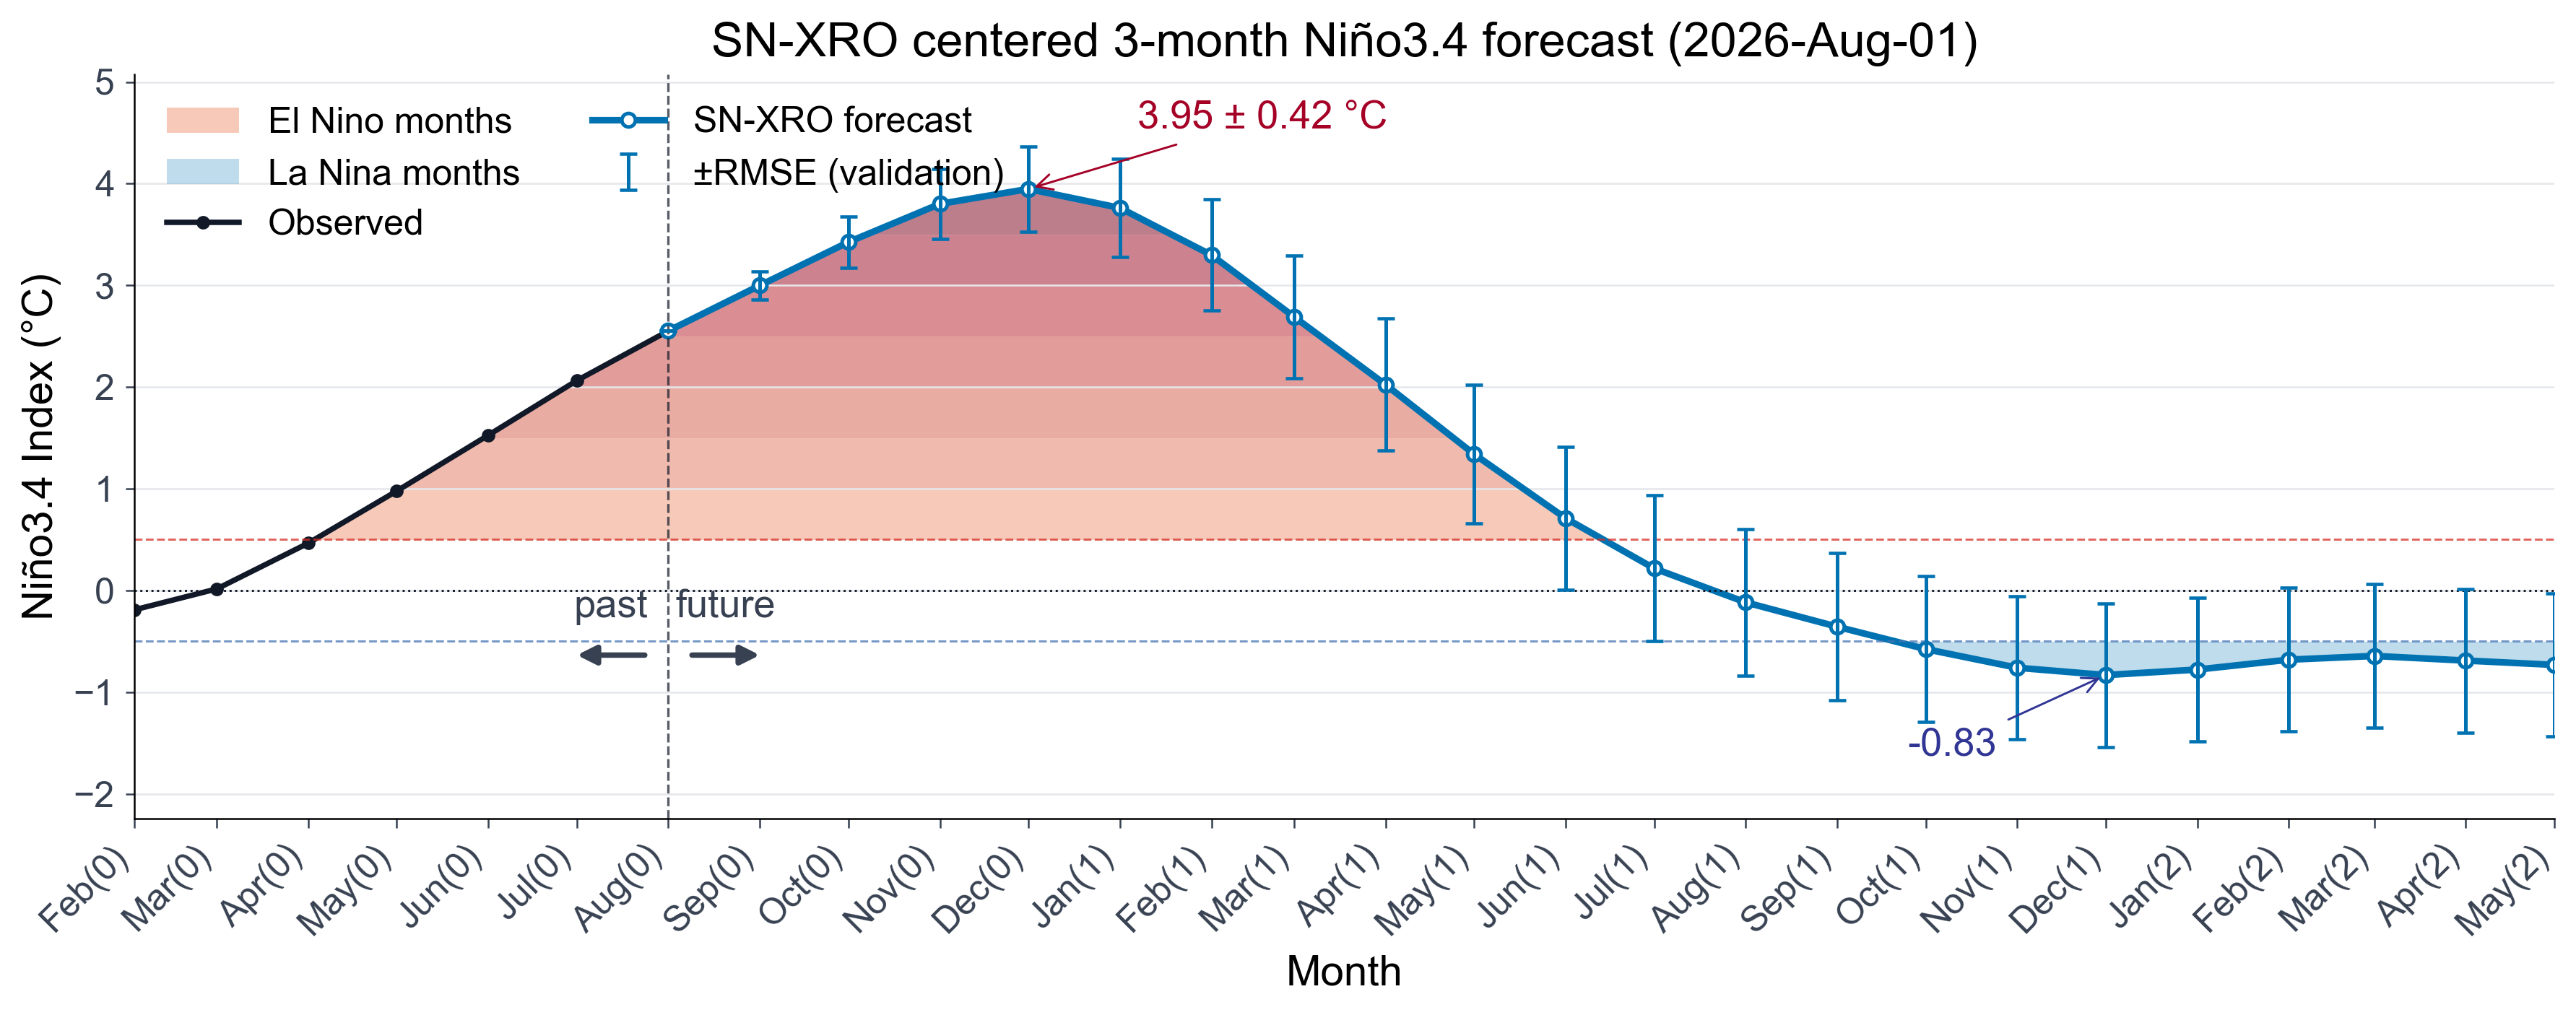 *Figure 3: SN-XRO centered three-month Niño3.4 forecast initialized from August 2026 monthly data. The black curve shows the observed Niño3.4 index before initialization, and the blue curve shows the SN-XRO forecast afterward. Error bars indicate the lead-dependent ±RMSE, averaged equally over past and recent validation periods; leads 16–21 reuse the lead-15 value. Red and blue layered shading marks the months exceeding the El Niño and La Niña thresholds, respectively, with darker colors indicating stronger anomalies. The vertical dashed line separates the observations from the forecast, and the annotated values indicate the strongest cold and warm anomalies.*
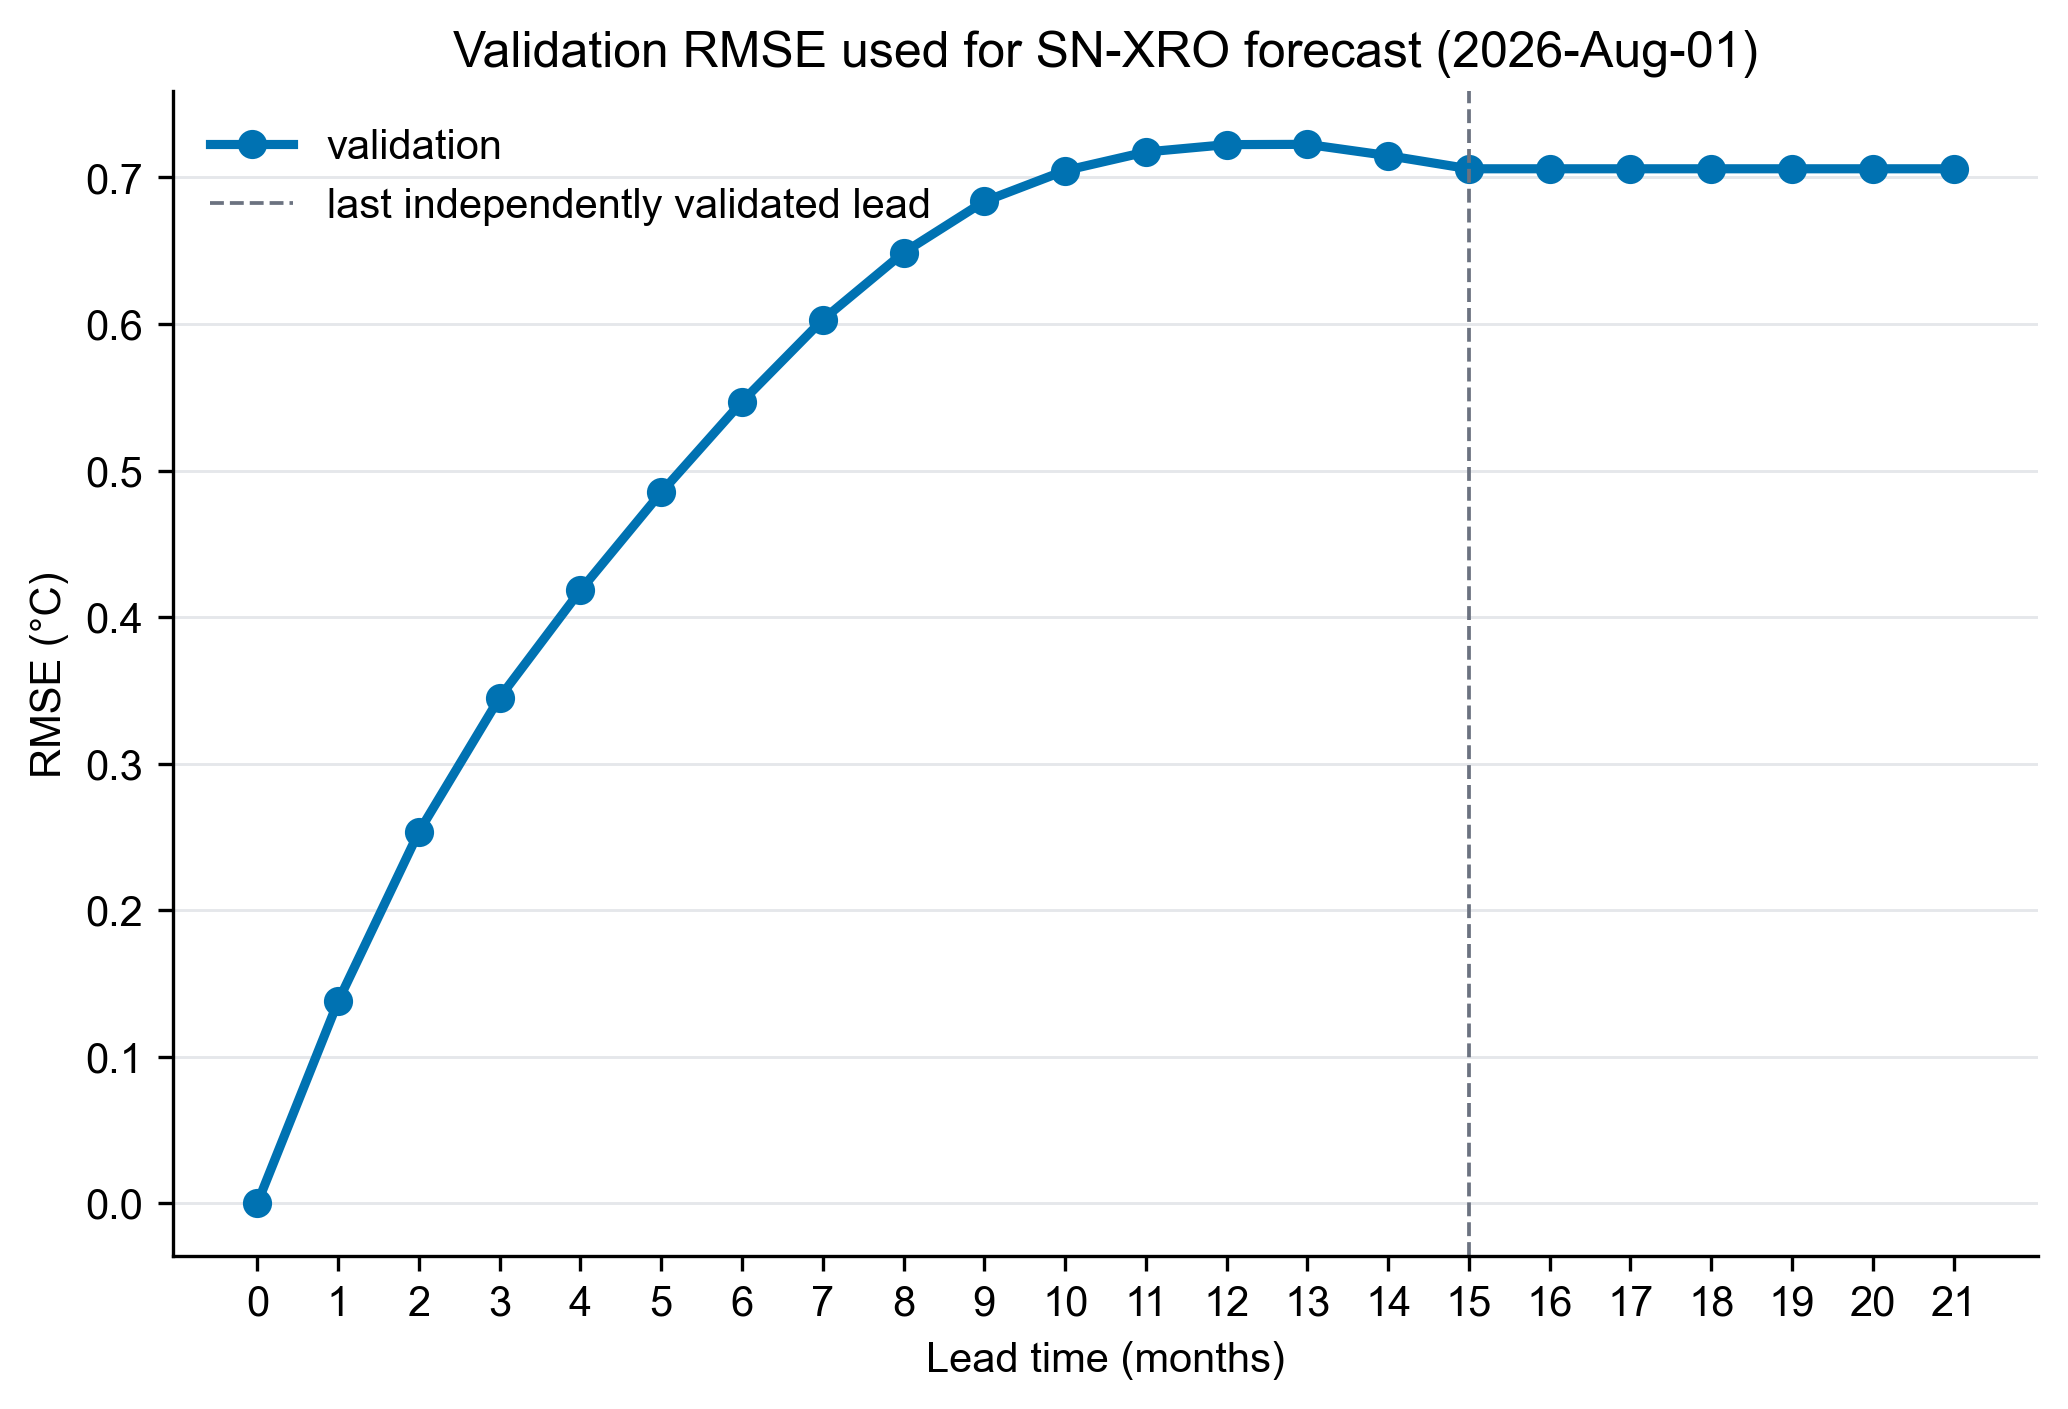 *Figure 4: Validation RMSE used for the SN-XRO centered three-month Niño3.4 forecast initialized from August 2026 monthly data. The blue curve shows the lead-dependent RMSE estimated from validation experiments and used as the ±RMSE uncertainty range in the real-time forecast. The horizontal axis shows lead time from 0 to 21 months (leads 16–21 reuse the lead-15 RMSE), and the vertical axis gives RMSE in degrees Celsius.*