利用物理引导的深度回声状态网络提升ENSO的可预测性极限
基于 ORAS5 再分析资料与物理引导深度回声状态网络(DESN)的 ENSO 实时预报方法,结合气候模态指数构建、去季节与去趋势处理、集合训练与成员筛选流程,给出 2026-2027 年 Niño3.4 预测结果。
基于 ORAS5 再分析资料与物理引导深度回声状态网络(DESN)的 ENSO 实时预报方法,结合气候模态指数构建、去季节与去趋势处理、集合训练与成员筛选流程,给出 2026-2027 年 Niño3.4 预测结果。
起报时间: 2026年08月 | 时效: 21个月 (2026-09至2028-05)
模型: DESN | 代码: https://github.com/zhangzejing/RC-ENSO
作者: 赵玉 | 邮箱: zhao774629876@163.com;张泽泾 | 邮箱: zjuer_zzj@163.com
ORAS5 (Ocean ReAnalysis System 5) 由 ECMWF 运行,是 Copernicus C3S 全球海洋再分析产品,分辨率 0.25°×0.25°,垂向 75 层,覆盖 1958 年至今。同化系统为 NEMO 海洋模式 + NEMOVAR 3D-Var FGAT,同化卫星 SST、海面高度、Argo 温盐廓线及海冰密集度。
本预报使用其中两个物理量:海表温度 (Sea Surface Temperature, SST sosstsst) 和 20°C等温线深度 (Depth of 20°C isotherm, D20 so20chgt)。原始数据为逐月气候格点数据(空间分辨率0.25°×0.25°,覆盖时间1958-01至2026-08,长度824个月)。
1.构造区域时间序列: 两个变量(Variable)的对应模式(mode)所指向区域(Region)按以下区域进行格点空间平均,每个模式得到一条时间序列,共计10条时间序列(时间长度824 个月):
| # | Mode | Full Name | Region (lat, lon) | Variable |
|---|---|---|---|---|
| 1 | Niño3.4 | Niño 3.4 Index | 5°S–5°N, 170°W–120°W | SST |
| 2 | WWV | Warm Water Volume | 5°S–5°N, 120°E–80°W | D20 |
| 3 | NPMM | North Pacific Meridional Mode | 10°–25°N, 160°W–120°W | SST |
| 4 | SPMM | South Pacific Meridional Mode | 25°–15°S, 110°–90°W | SST |
| 5 | IOB | Indian Ocean Basin Mode | 20°S–20°N, 40°–100°E | SST |
| 6 | TNA | Tropical North Atlantic Index | 5°–25°N, 55°–15°W | SST |
| 7 | ATL3 | Atlantic Niño 3 Index | 3°S–3°N, 20°W–0° | SST |
| 8 | IOD | Indian Ocean Dipole | (10°S–10°N, 50°–70°E) − (10°S–0°, 90°–110°E) | SST |
| 9 | SIOD | Southern Indian Ocean Dipole | (25°–10°S, 65°–85°E) − (30°–5°S, 90°–120°E) | SST |
| 10 | SASD | South Atlantic Subtropical Dipole | (40°–30°S, 30°–10°W) − (25°–15°S, 20°W–0°) | SST |
2.去季节循环:
即计算月距平,设原始序列为 , 表示时间, 表示气候态时间段对应的月份,月距平为:
其中:
其中气候态时间段为1979-01至2009-12
3.去二次趋势:
将时间转为月份序号 ,并拟合二次趋势:
去趋势后为:
其中:
最终得到去季节循环、去二次趋势后的气候模式指数。
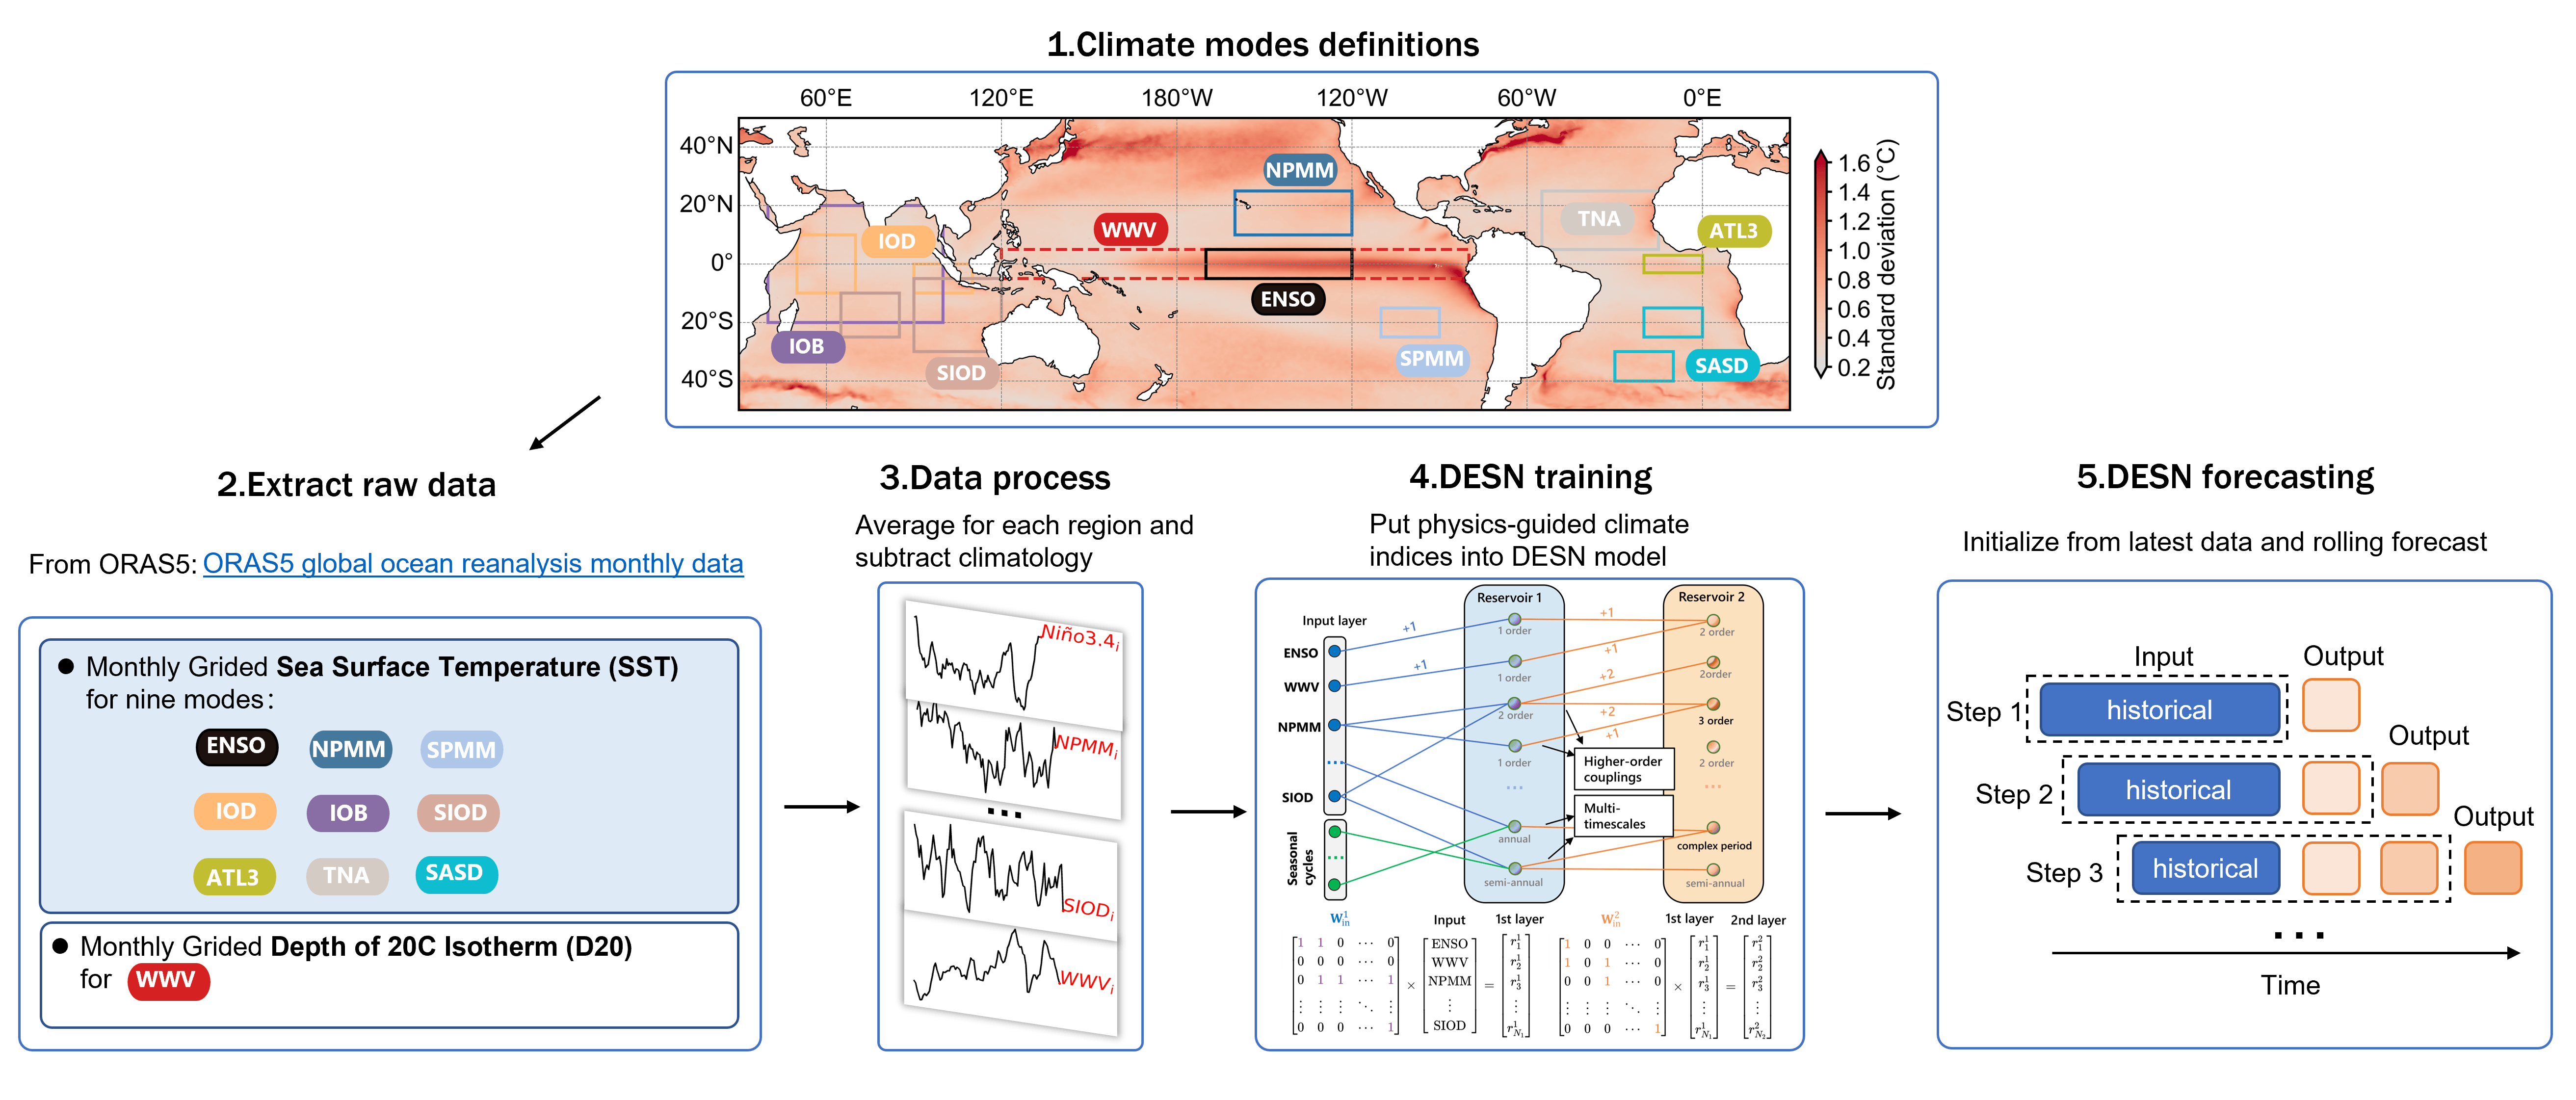
*Figure: Schematic workflow of the DESN real-time ENSO forecasting system. Climate-mode indices are extracted from ORAS5 monthly ocean reanalysis fields, including regional sea surface temperature indices and equatorial warm water volume. The processed indices are used to train the DESN model, which is then initialized with the latest available observations to produce rolling real-time forecasts.*
上图所示的1.区域定义(Climate mode definitions)和2.数据提取和3.数据处理(Extract raw data & Data process)环节已由第一部分介绍。
关于4.模型训练(DESN training)和5.模型预测(DESN forecasting)环节,下面为简单的介绍
DESN 是一种物理引导的轻量化机器学习预报模型,详见:
输入:第一部分介绍的气候指数,并上年循环及半年循环时间周期编码(Seasonal cycles)。
输出:新1个月的10个气候模态指数,通过滚动输入(rolling-input)获取更多月预测结果。
训练与验证标准流程:
DESN预报结果:
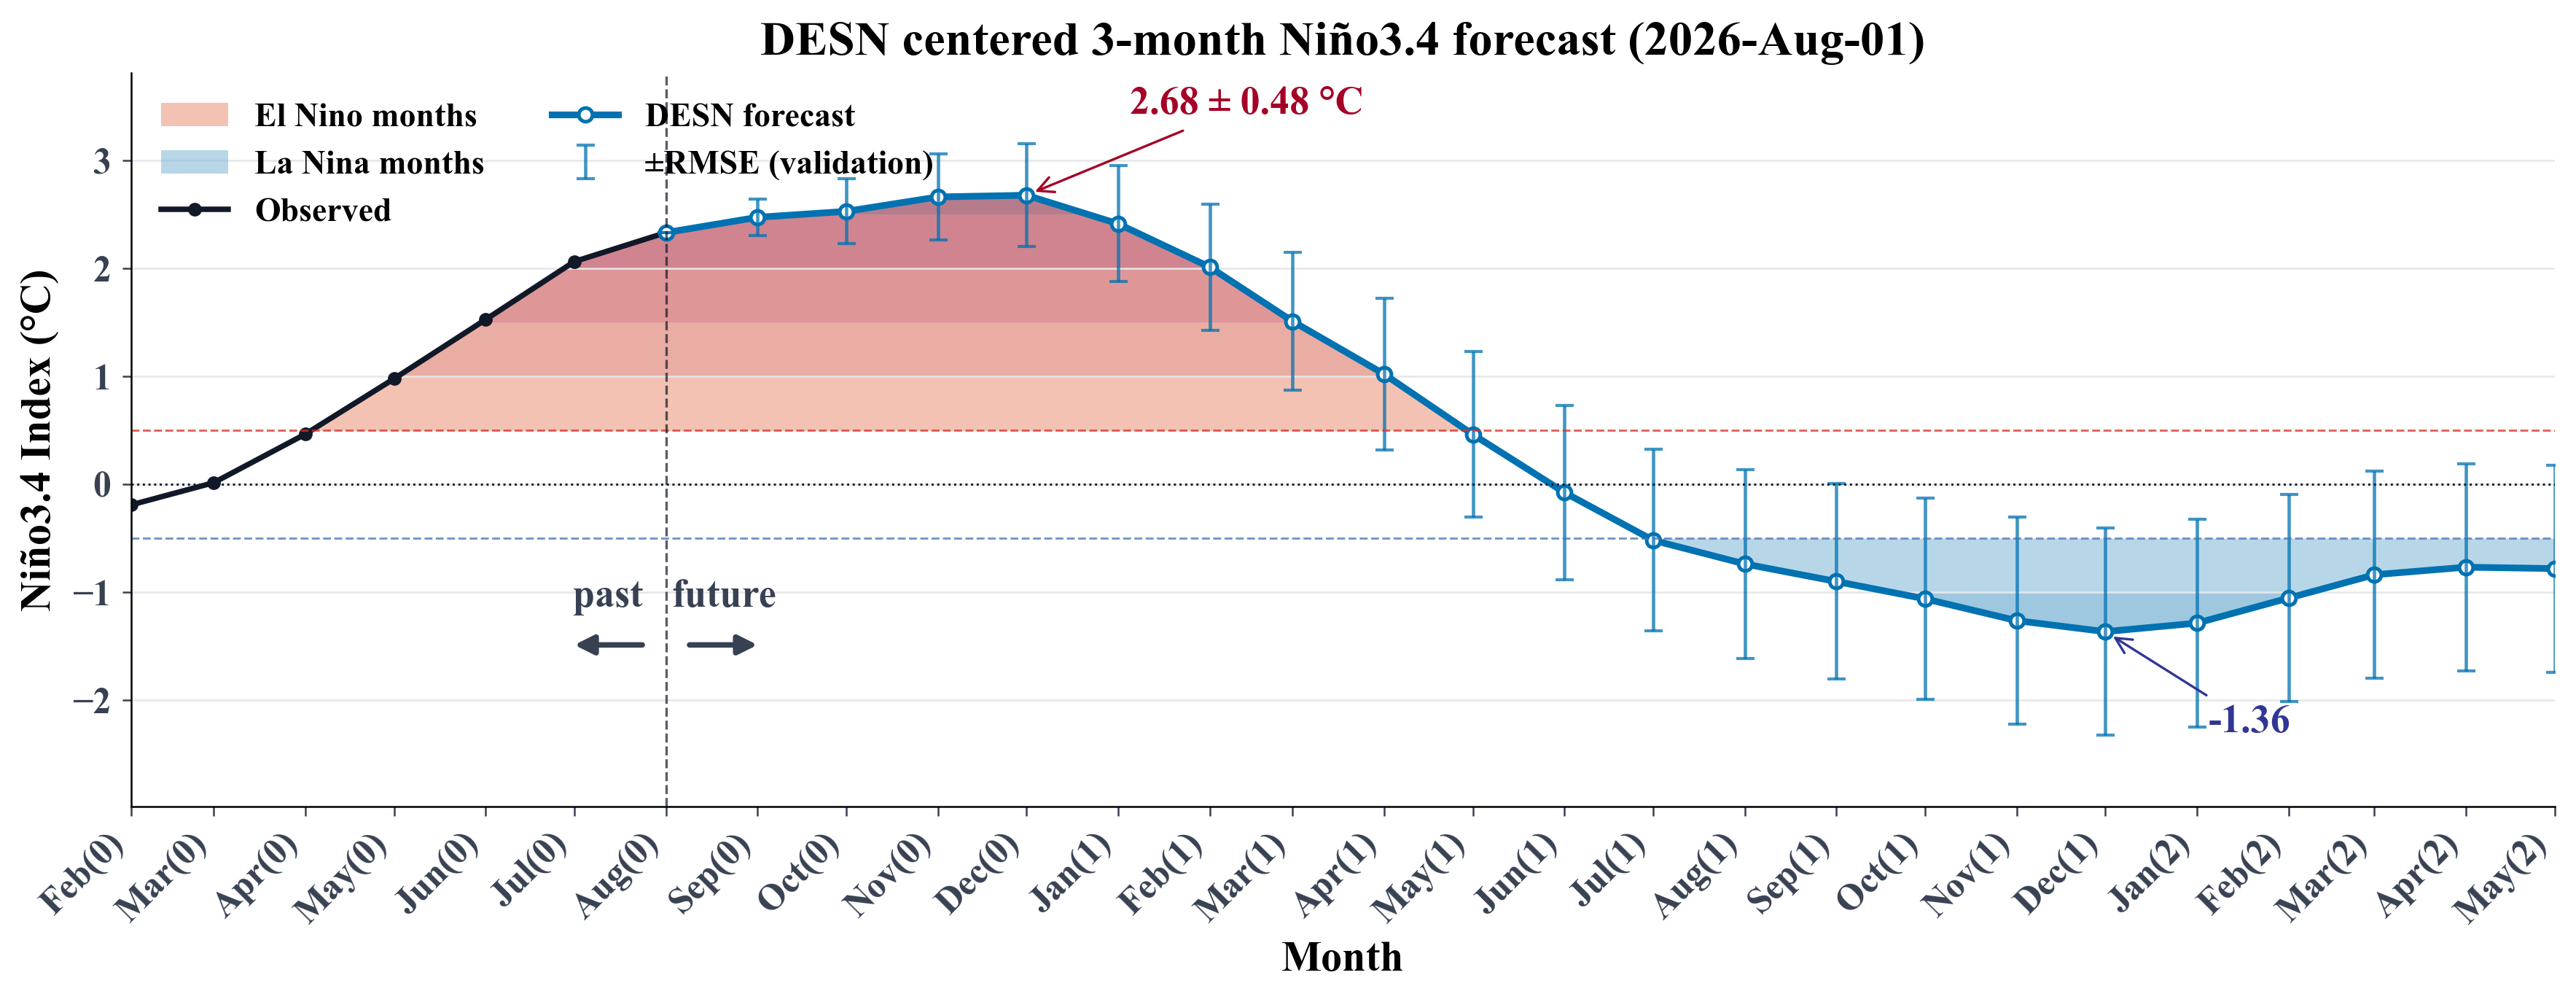
***Figure 1:DESN centered three-month Niño3.4 forecast initialized from August 2026 monthly data. The black curve shows the observed Niño3.4 index before initialization, and the blue curve shows the DESN ensemble-mean forecast afterward. Error bars indicate the lead dependent ±RMSE, averaged equally over past and recent validation periods; leads 16–21 reuse the lead-15 value. Red and blue shading mark months exceeding the El Niño and La Niña thresholds, respectively. The vertical dashed line separates the observed past from the forecast future, and the annotated values indicate the strongest warm and cold anomalies during the forecast period.*
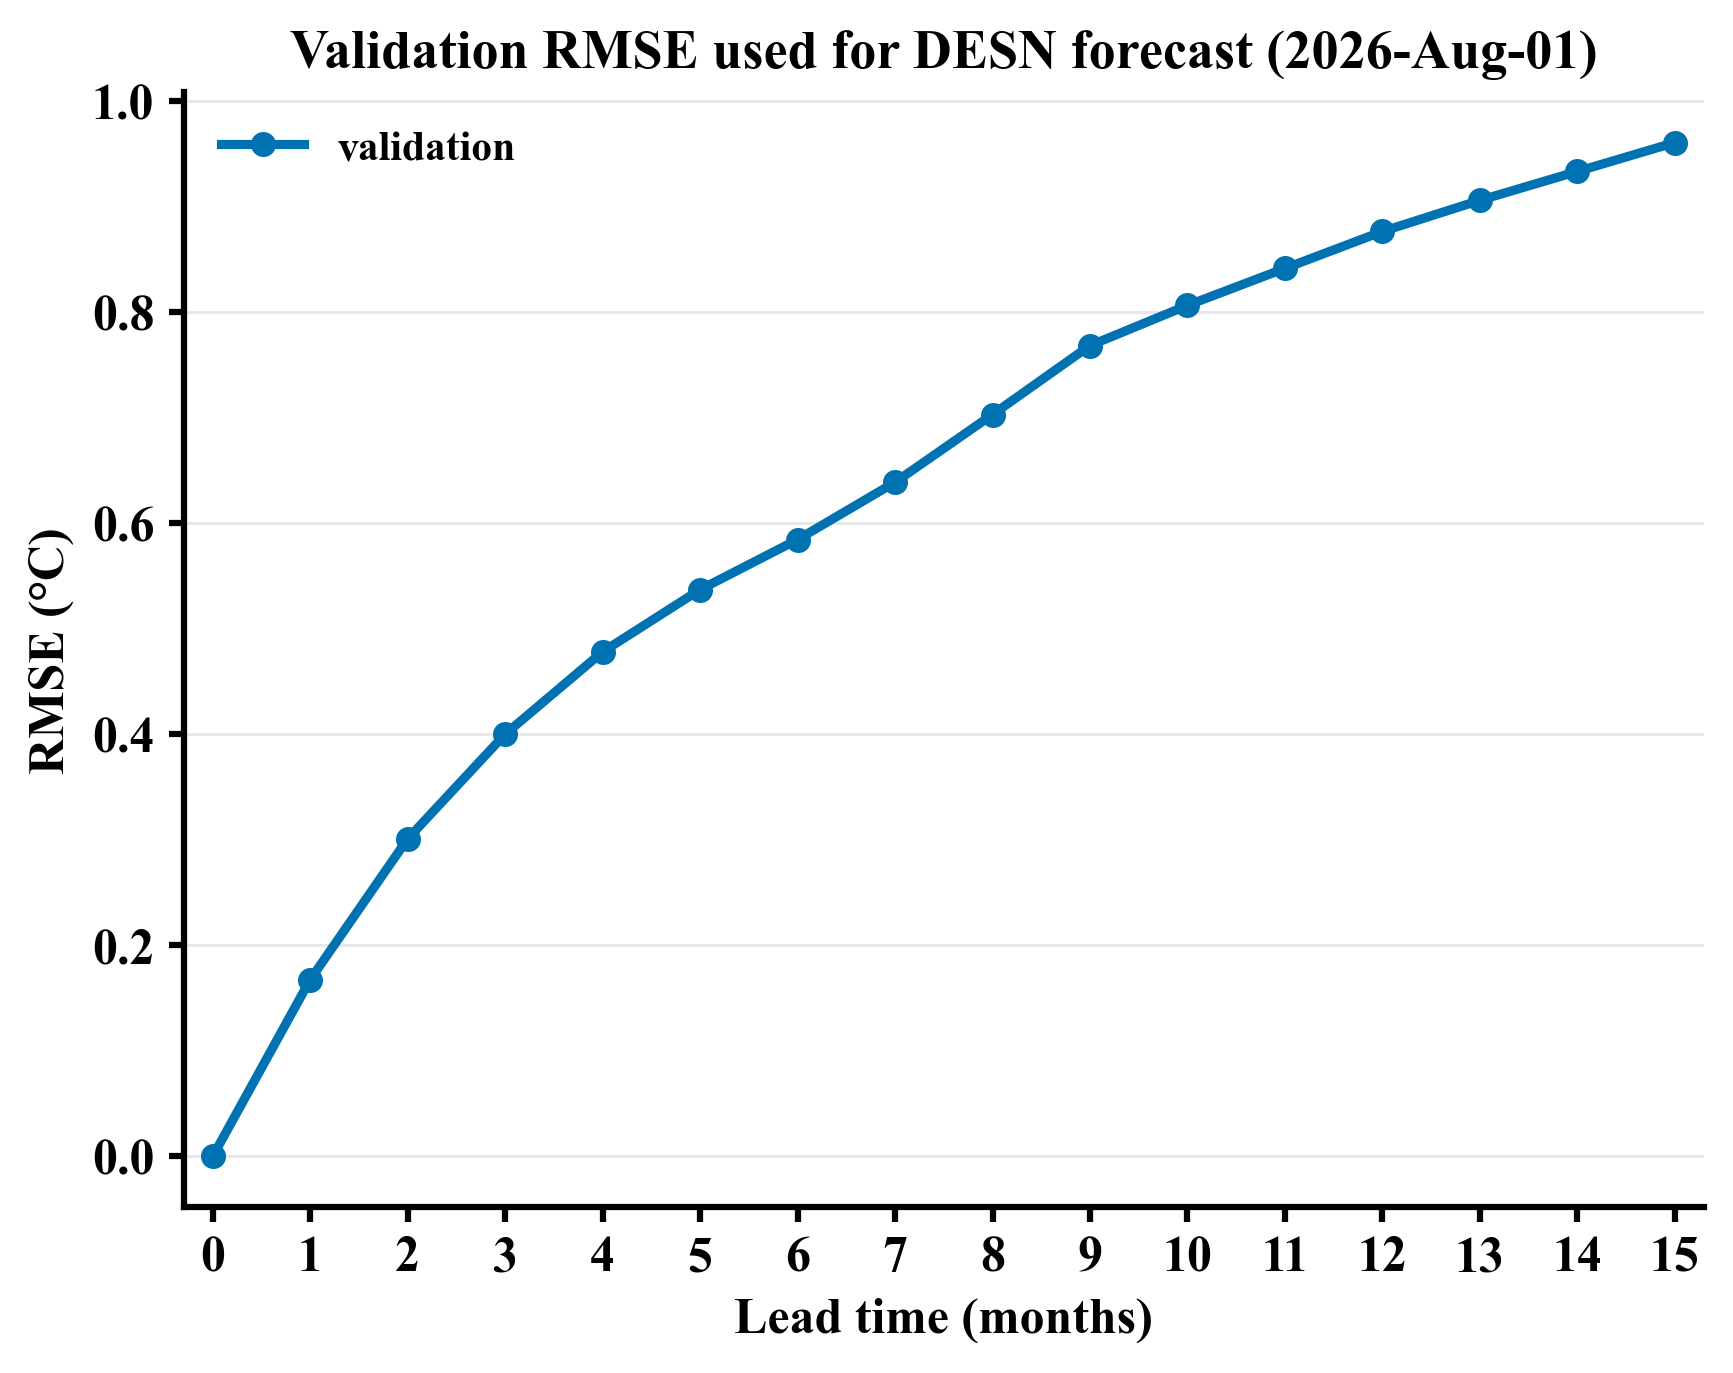
***Figure 2:Validation RMSE used for DESN centered three-month Niño3.4 forecast initialized from August 2026 monthly data. The blue curve shows the lead-dependent RMSE estimated from validation experiments and used as the ±RMSE uncertainty range in the real-time forecast. The horizontal axis shows lead time from 0 to 15 months, and the vertical axis gives RMSE in degrees Celsius.*
本次预测以2026年8月月平均数据初始化。DESN 预测显示,Niño3.4 月值在起报时已升至约 +2.62°C(图中居中三个月平均值约 +2.33°C),处于显著偏暖状态,并在预测初期继续维持在 +0.5°C 以上的 El Niño 阈值。预报结果显示,暖异常将在 2026 年秋季至冬季持续增强,并在 2026 年 12 月前后达到峰值,居中三个月平均峰值约为 +2.68°C,对应一次较强的 El Niño 事件。
2027 年初之后,暖异常逐渐减弱。Niño3.4 指数预计在 2027 年 5 月前后回落至 El Niño 阈值以下,随后转为中性偏冷状态。预报显示,Niño3.4 指数将在 2027 年 7 月起低于 -0.5°C 的 La Niña 阈值,并在 2027 年 12 月前后达到冷异常峰值,最低约为 -1.36°C。
总体来看,DESN 预测倾向于 2026 年下半年至 2026/2027 年冬季发生一次较强 El Niño 事件,随后 ENSO 状态于2027年夏季转向 La Niña 状态。图中的误差棒给出了基于验证集 RMSE 的逐提前期不确定性估计,在lead 1–15随提前期增加而增大,lead 16–21沿用lead 15的约0.96°C。
SN-XRO预报结果:
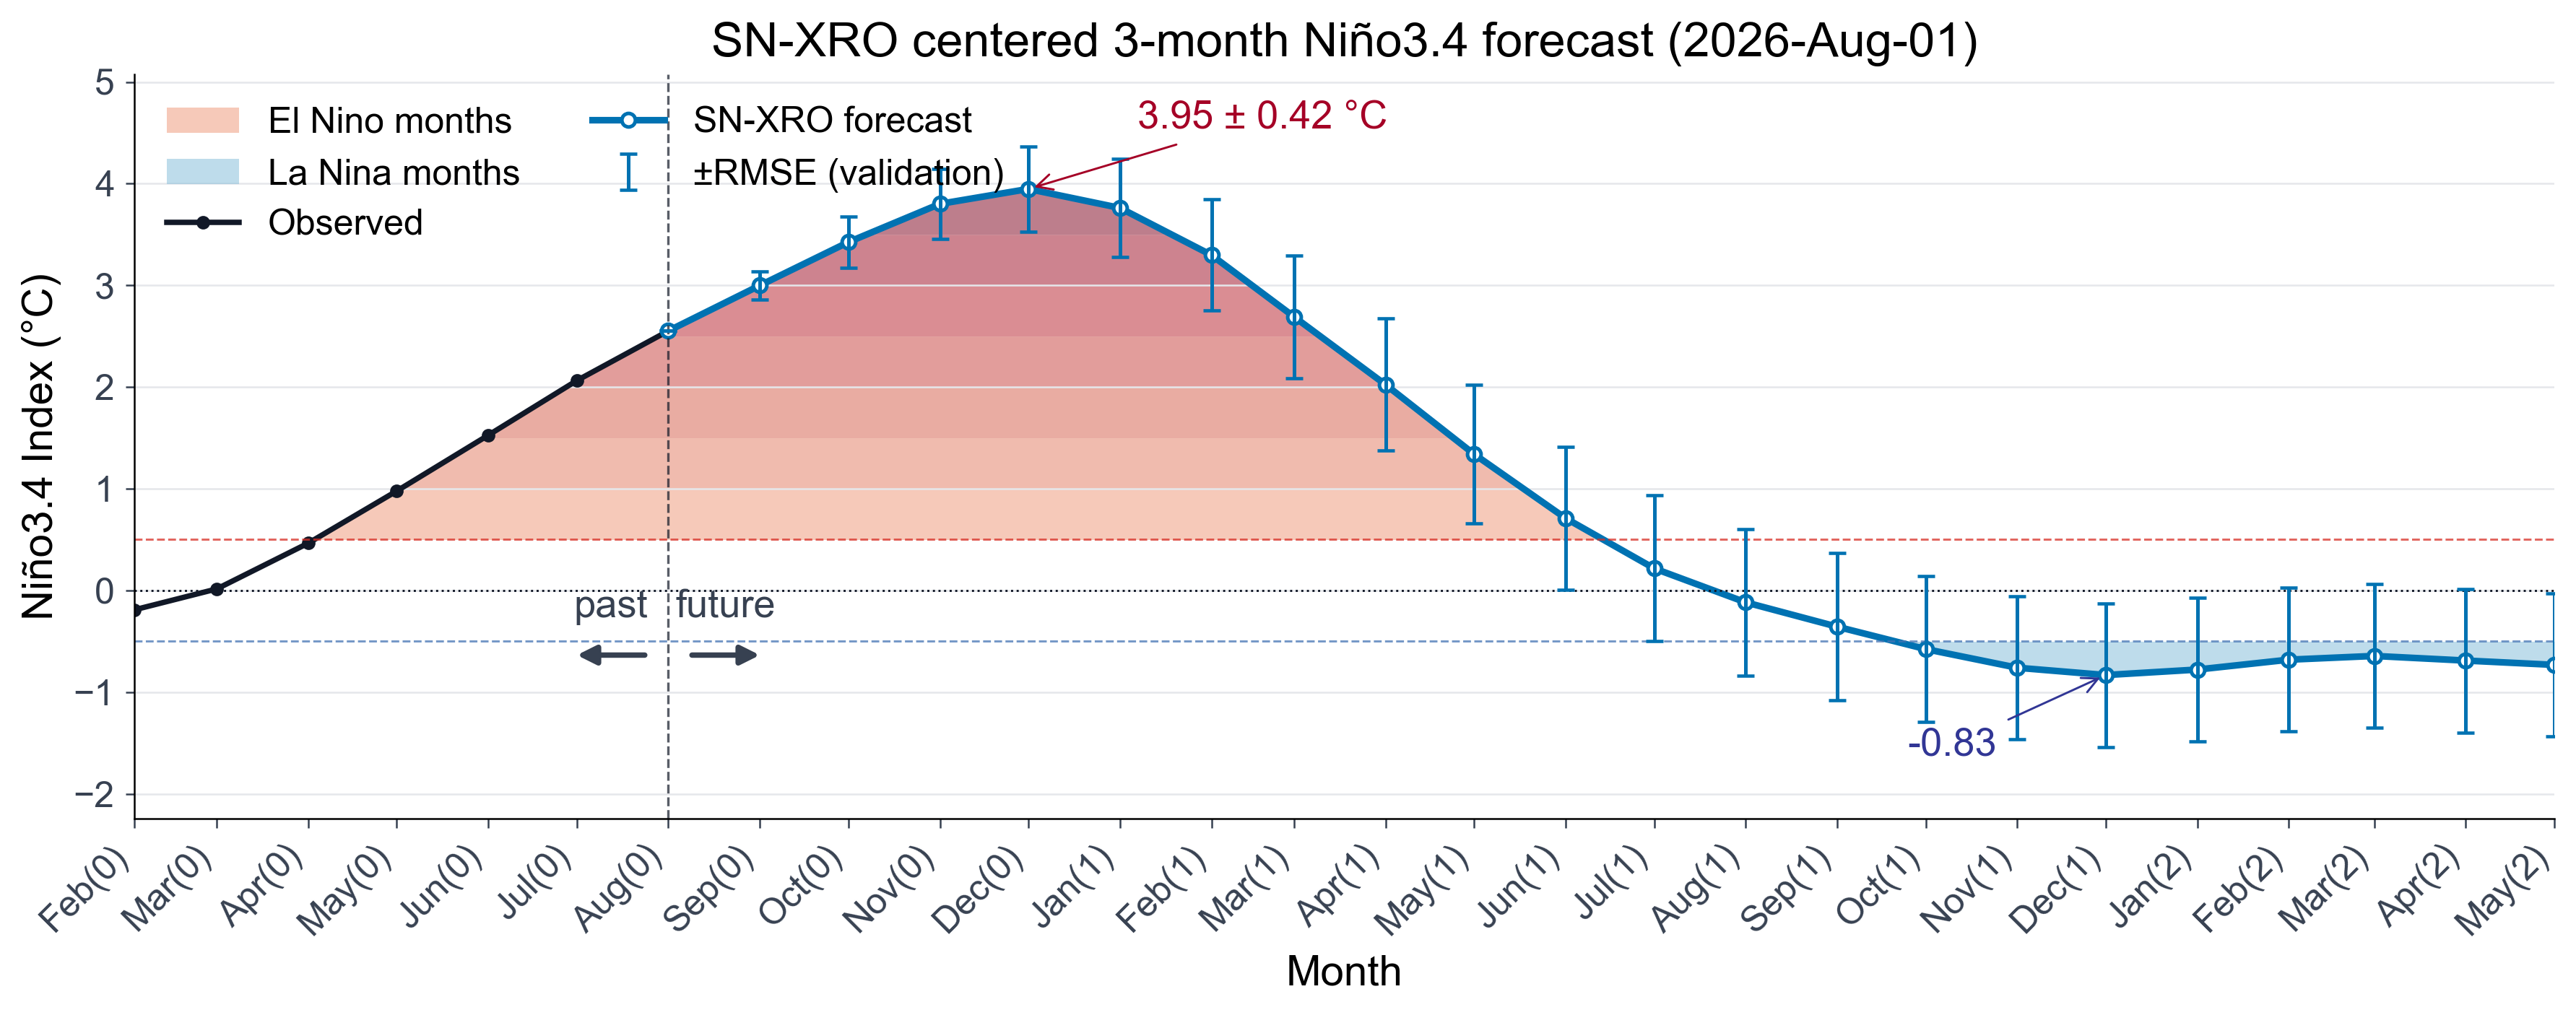
***Figure 3: SN-XRO centered three-month Niño3.4 forecast initialized from August 2026 monthly data. The black curve shows the observed Niño3.4 index before initialization, and the blue curve shows the SN-XRO forecast afterward. Error bars indicate the lead-dependent ±RMSE, averaged equally over past and recent validation periods; leads 16–21 reuse the lead-15 value. Red and blue layered shading marks the months exceeding the El Niño and La Niña thresholds, respectively, with darker colors indicating stronger anomalies. The vertical dashed line separates the observations from the forecast, and the annotated values indicate the strongest cold and warm anomalies.*
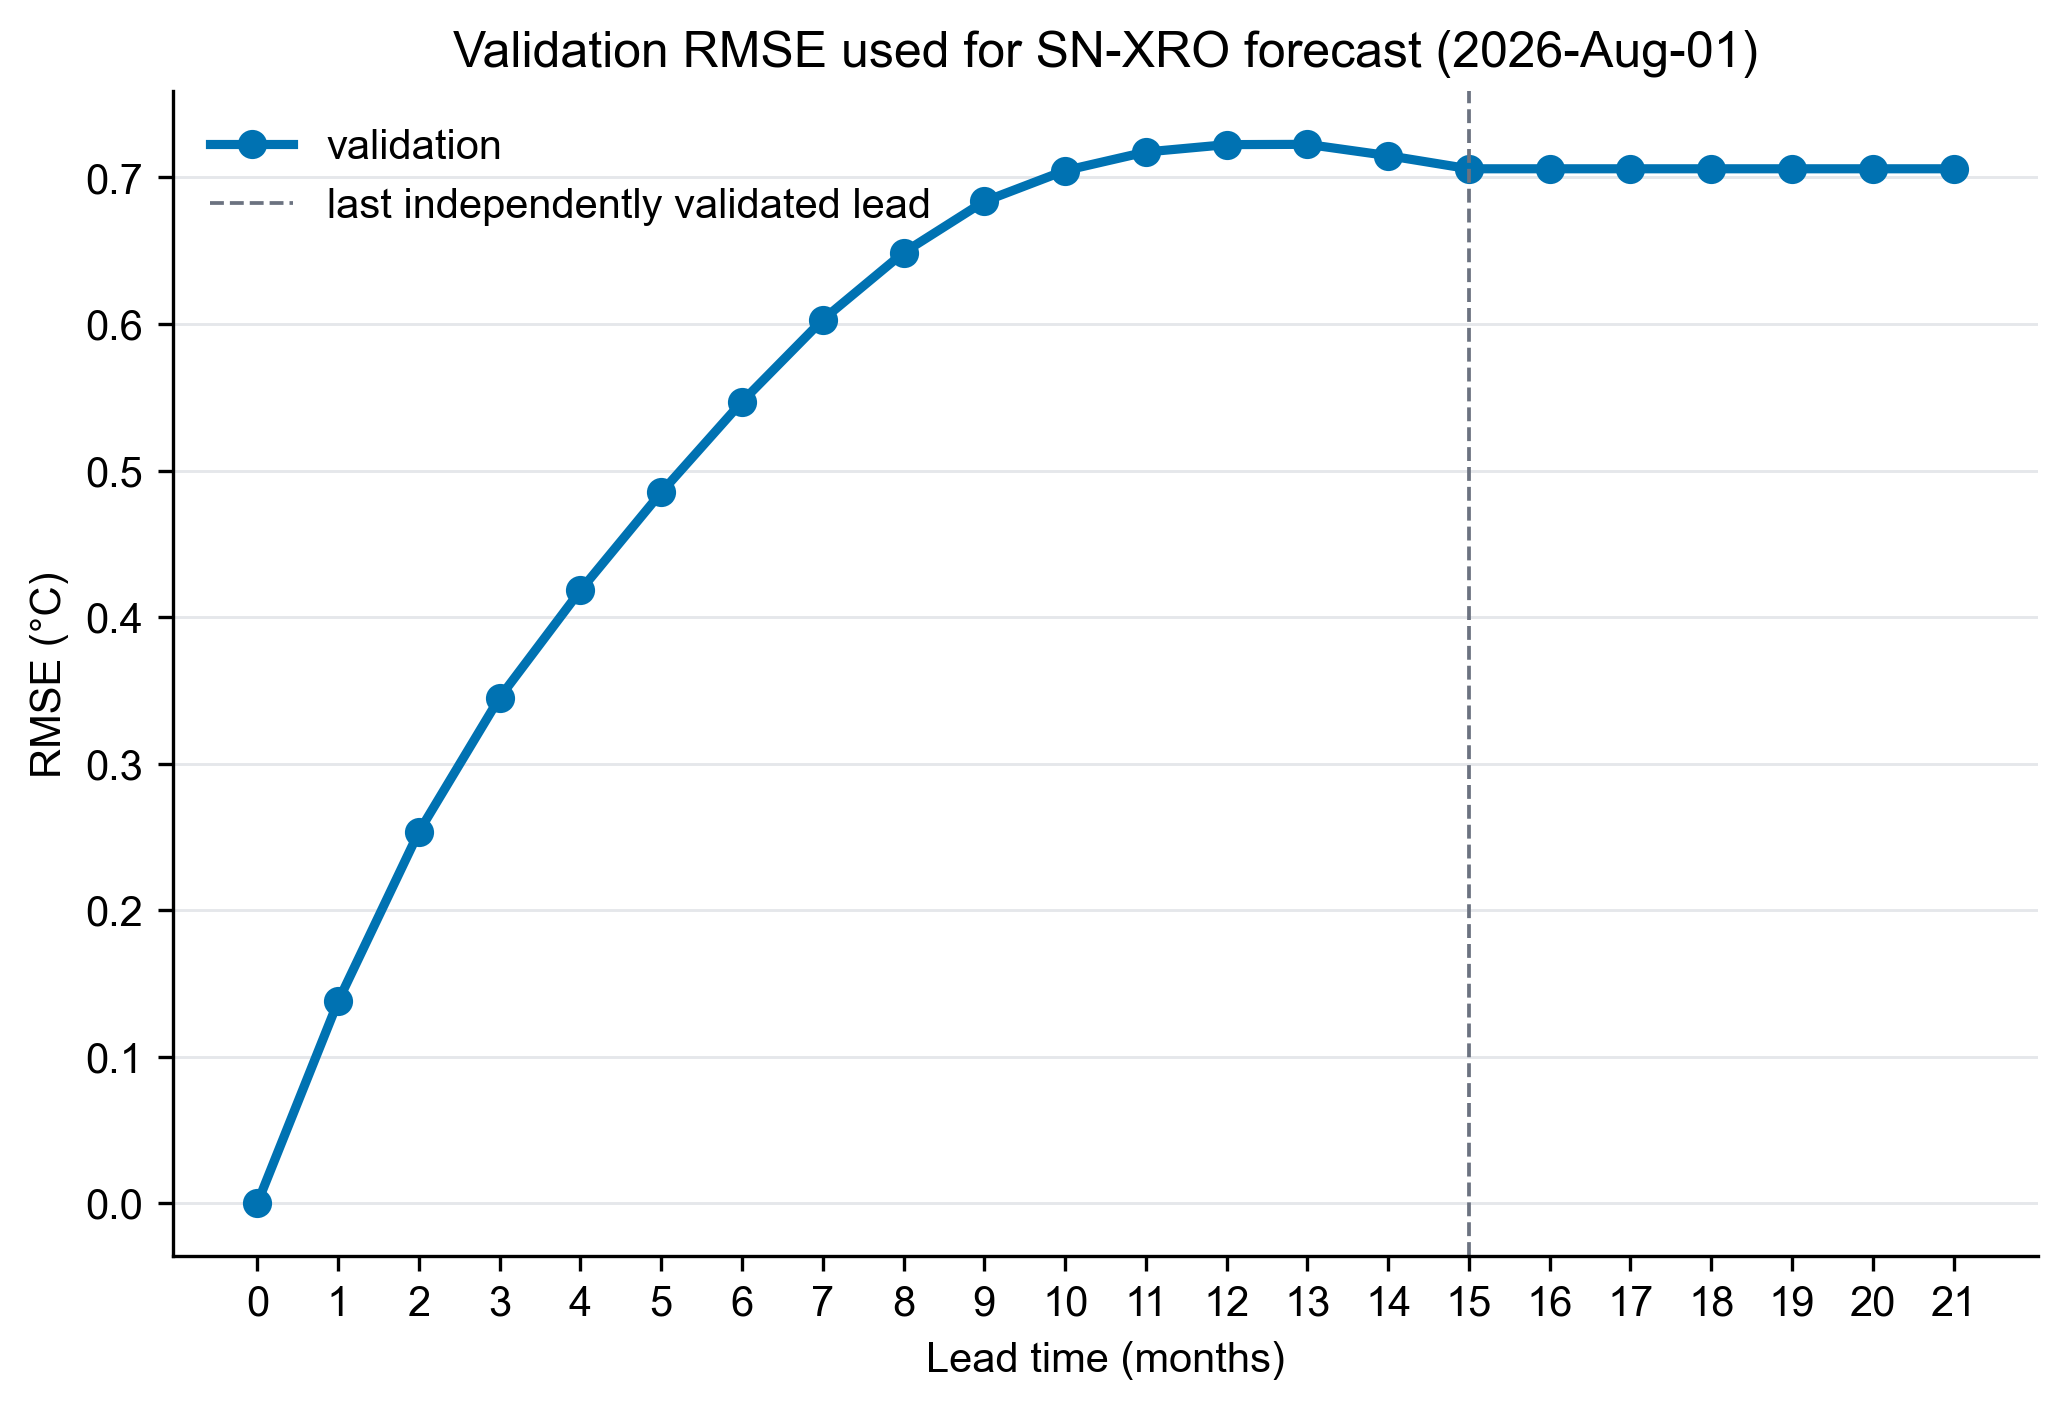
***Figure 4: Validation RMSE used for the SN-XRO centered three-month Niño3.4 forecast initialized from August 2026 monthly data. The blue curve shows the lead-dependent RMSE estimated from validation experiments and used as the ±RMSE uncertainty range in the real-time forecast. The horizontal axis shows lead time from 0 to 21 months (leads 16–21 reuse the lead-15 RMSE), and the vertical axis gives RMSE in degrees Celsius.*
本次预测以2026年8月月平均数据初始化,此时 Niño3.4 月值已升至约 +2.62°C(图中居中三个月平均值约 +2.55°C),处于 El Niño 状态(起报前的 2025 年底曾出现弱 La Niña,居中三个月平均最低约 −0.78°C)。SN-XRO 预测暖异常将在 2026 年秋季继续增强,并于 2026 年 12 月前后达到峰值,居中三个月平均约 +3.95°C,对应一次极强 El Niño 事件。
2027 年初之后暖异常逐渐衰减,预计在 2027 年 7 月前后回落至 +0.5°C 阈值以下,转入中性。随后在2027年10月降至 −0.5°C 以下,并于2027年12月达到冷异常峰值约 −0.83°C;至预报末端(2028 年 5 月)仍约为 −0.73°C,低于 La Niña 阈值。
总体来看,SN-XRO 预测倾向于 2026 年下半年至 2026/2027 年冬季发展为一次极强 El Niño 事件,成熟期在 2026 年冬季至 2027 年初,于 2026 年 12 月达到峰值,随后于 2027 年夏季回归中性,并于秋季转向 La Niña 状态。